


The Data Behind the Fire: A Look Into Our Wildfire Model
Wildfires now result in nearly 6 million more hectares of tree cover loss per year than in 2001, an area the size of Croatia.
Feb 19, 2026
The Data Behind the Fire: A Look Into Our Wildfire Model
Wildfires now result in nearly 6 million more hectares of tree cover loss per year than in 2001, an area the size of Croatia.
Wildfires now result in nearly 6 million more hectares of tree cover loss per year than in 2001, an area the size of Croatia.
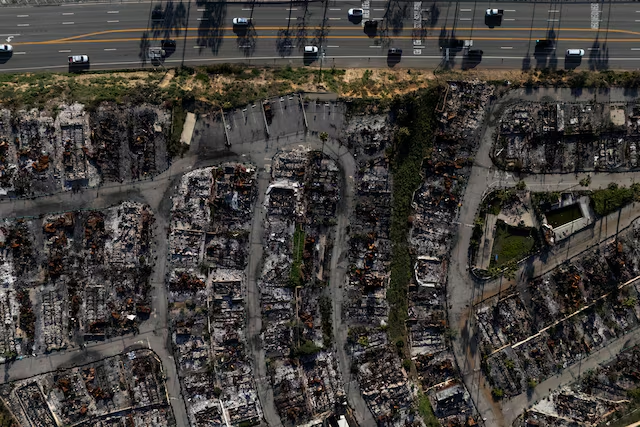
The LA Wildfires of January 2025 are estimated to have cost over $250 billion. This is the sixth year in a row that global insured losses from natural catastrophes have totalled to more than $100 billion according to Reuters. This comes as part of a trend of natural catastrophes causing increasing insurance losses year on year.
BirdsEyeView’s new wildfire model fills a gap in a market which is struggling to deal with the extensive and increasing damage inflicted globally by wildfires.
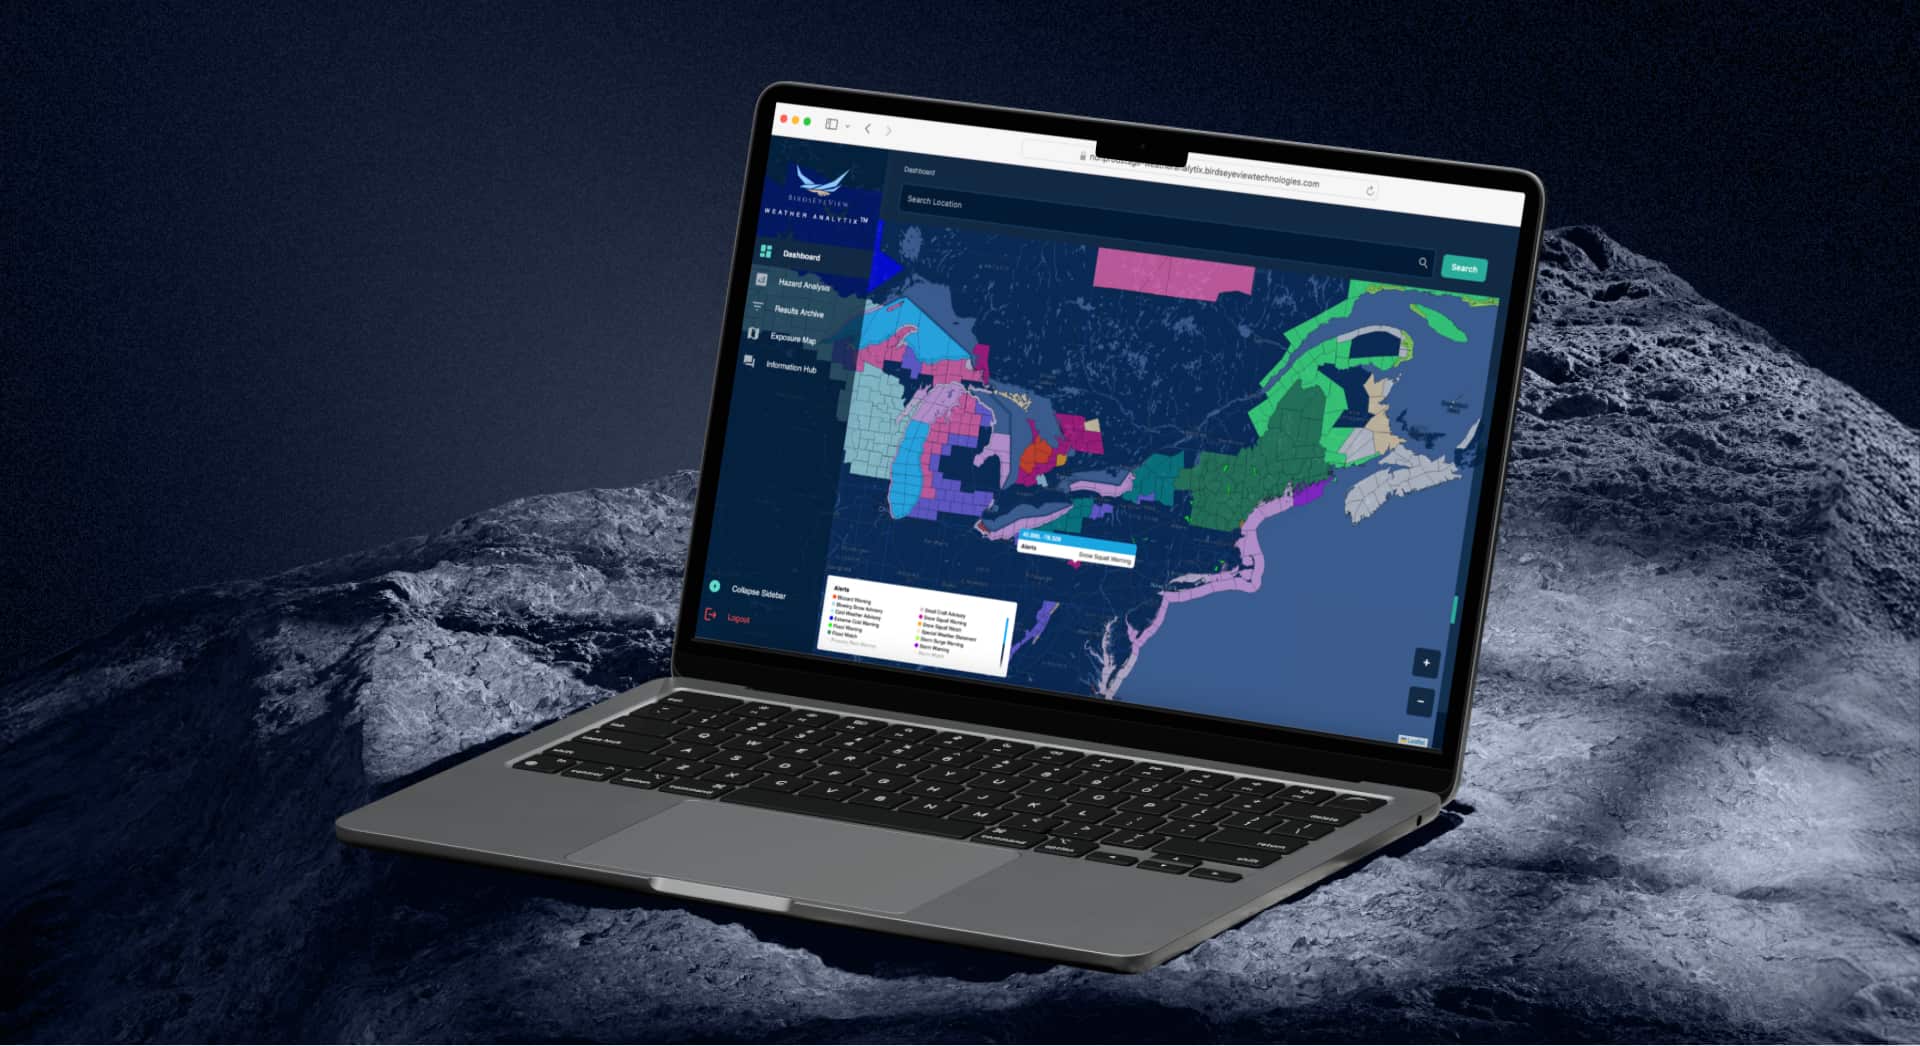
BirdsEyeView and Why This Matters
Many hazard models continue to focus on the ‘big five’, earthquakes, flooding, storms, droughts, and extreme heat. Yet wildfire risk is rapidly escalating. BirdsEyeView developed a dedicated wildfire model to help close this gap, combining deep expertise with a solution built for the growing global need.
The UN’s Global Assessment Report on Disaster Risk Reduction (GARDRR) outlines how important wildfires are within the current insurance market. “From 2014 to 2023, wildfires globally cost approximately $106 billion in economic losses and $74 billion in insured losses, significantly higher than losses in the decade before. Developing a clearer picture of wildfire average annual loss (AAL)s and probable maximal loss (PML)s in vulnerable areas could better inform planning decisions in the future”.
The LA wildfires in January 2025 and Australian Bushfires of summer 2019/20 highlight the increasing challenge of insurability. The homes affected in LA last year included 12,000 of the most expensive postcodes in the US. The UN's GARDRR explains the effect this has had on insurance in the area “California has a long-established public-private insurance scheme to cover homes in commercially unviable, high-risk areas. However, fires in 2017 and 2018 had already wiped out over two decades of profits, leading many companies to start retreating from these areas. This led more households to resort to the state’s own scheme. As of mid-February 2025, claims from last year’s fires were estimated to have left a gap of at least $1 billion in the fund. By US state law, this must be covered partially from private insurers operating in California (based on their market share) and partially by the state government and customers through future higher premiums. While authorities are bailing out the affected households, they are also calling for steps to enforce tighter building codes and more extensive risk reduction measures in the recovery. It is still too early to tell whether insurers will continue to operate in the state unless finance models are adjusted and risk reduction efforts can bring risk levels back to an insurable level.”
Key problem
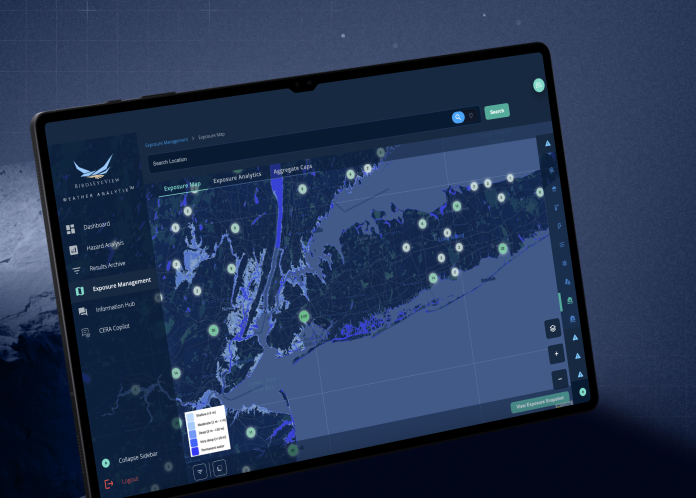
The global risk envelope for wildfires is shifting; pushing losses in some areas into territory that insurance models weren’t designed to handle. For insurers to be able to absorb financial shocks from these events, they require a deeper understanding of wildfire behaviour at the point of underwriting.
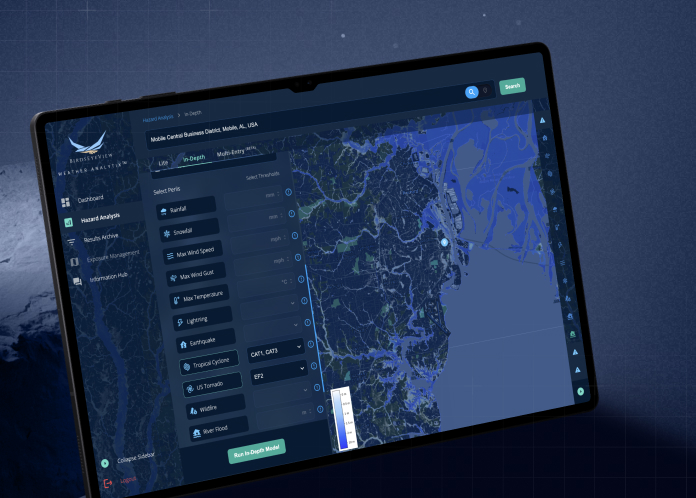
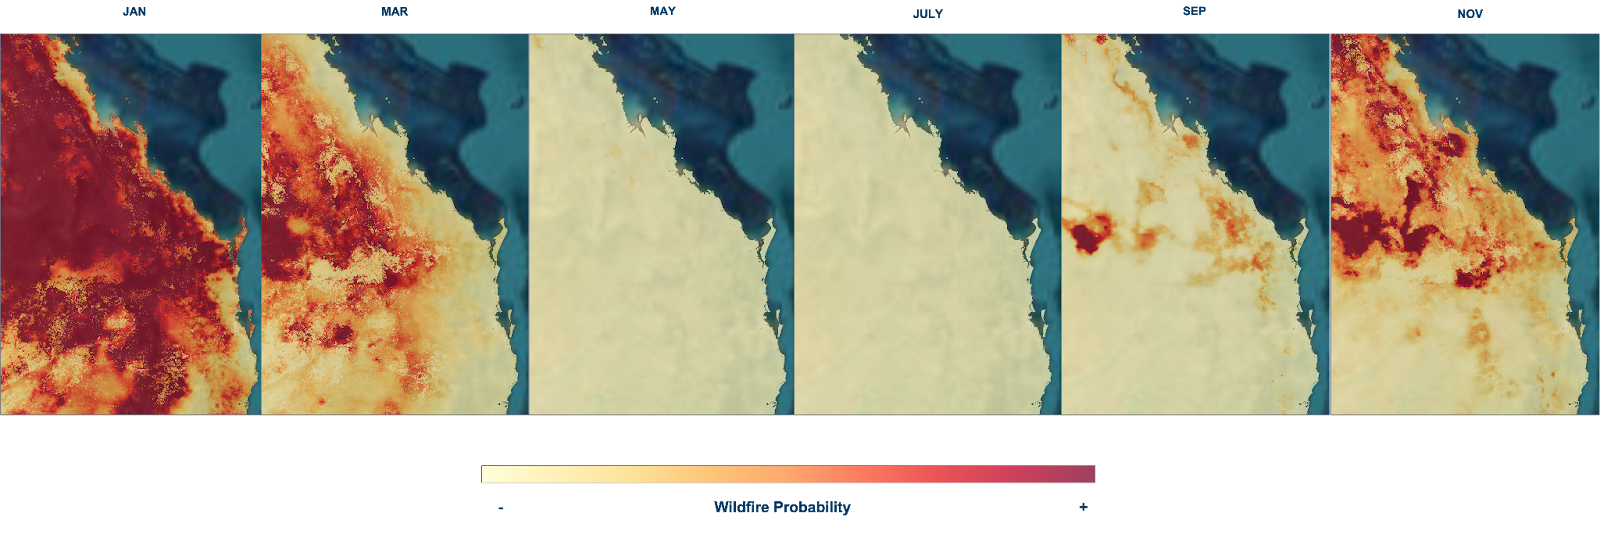
To achieve this, BirdsEyeView have created two continent-wide wildfire prediction models at 300m resolution, providing highly calibrated and interpretable wildfire risk predictions. The models provide localised insights at a fine scale, while covering entire countries. We currently have region-specific dynamics available for Australia and North America. Other regions will be rolled out during 2026.
What is this peril?
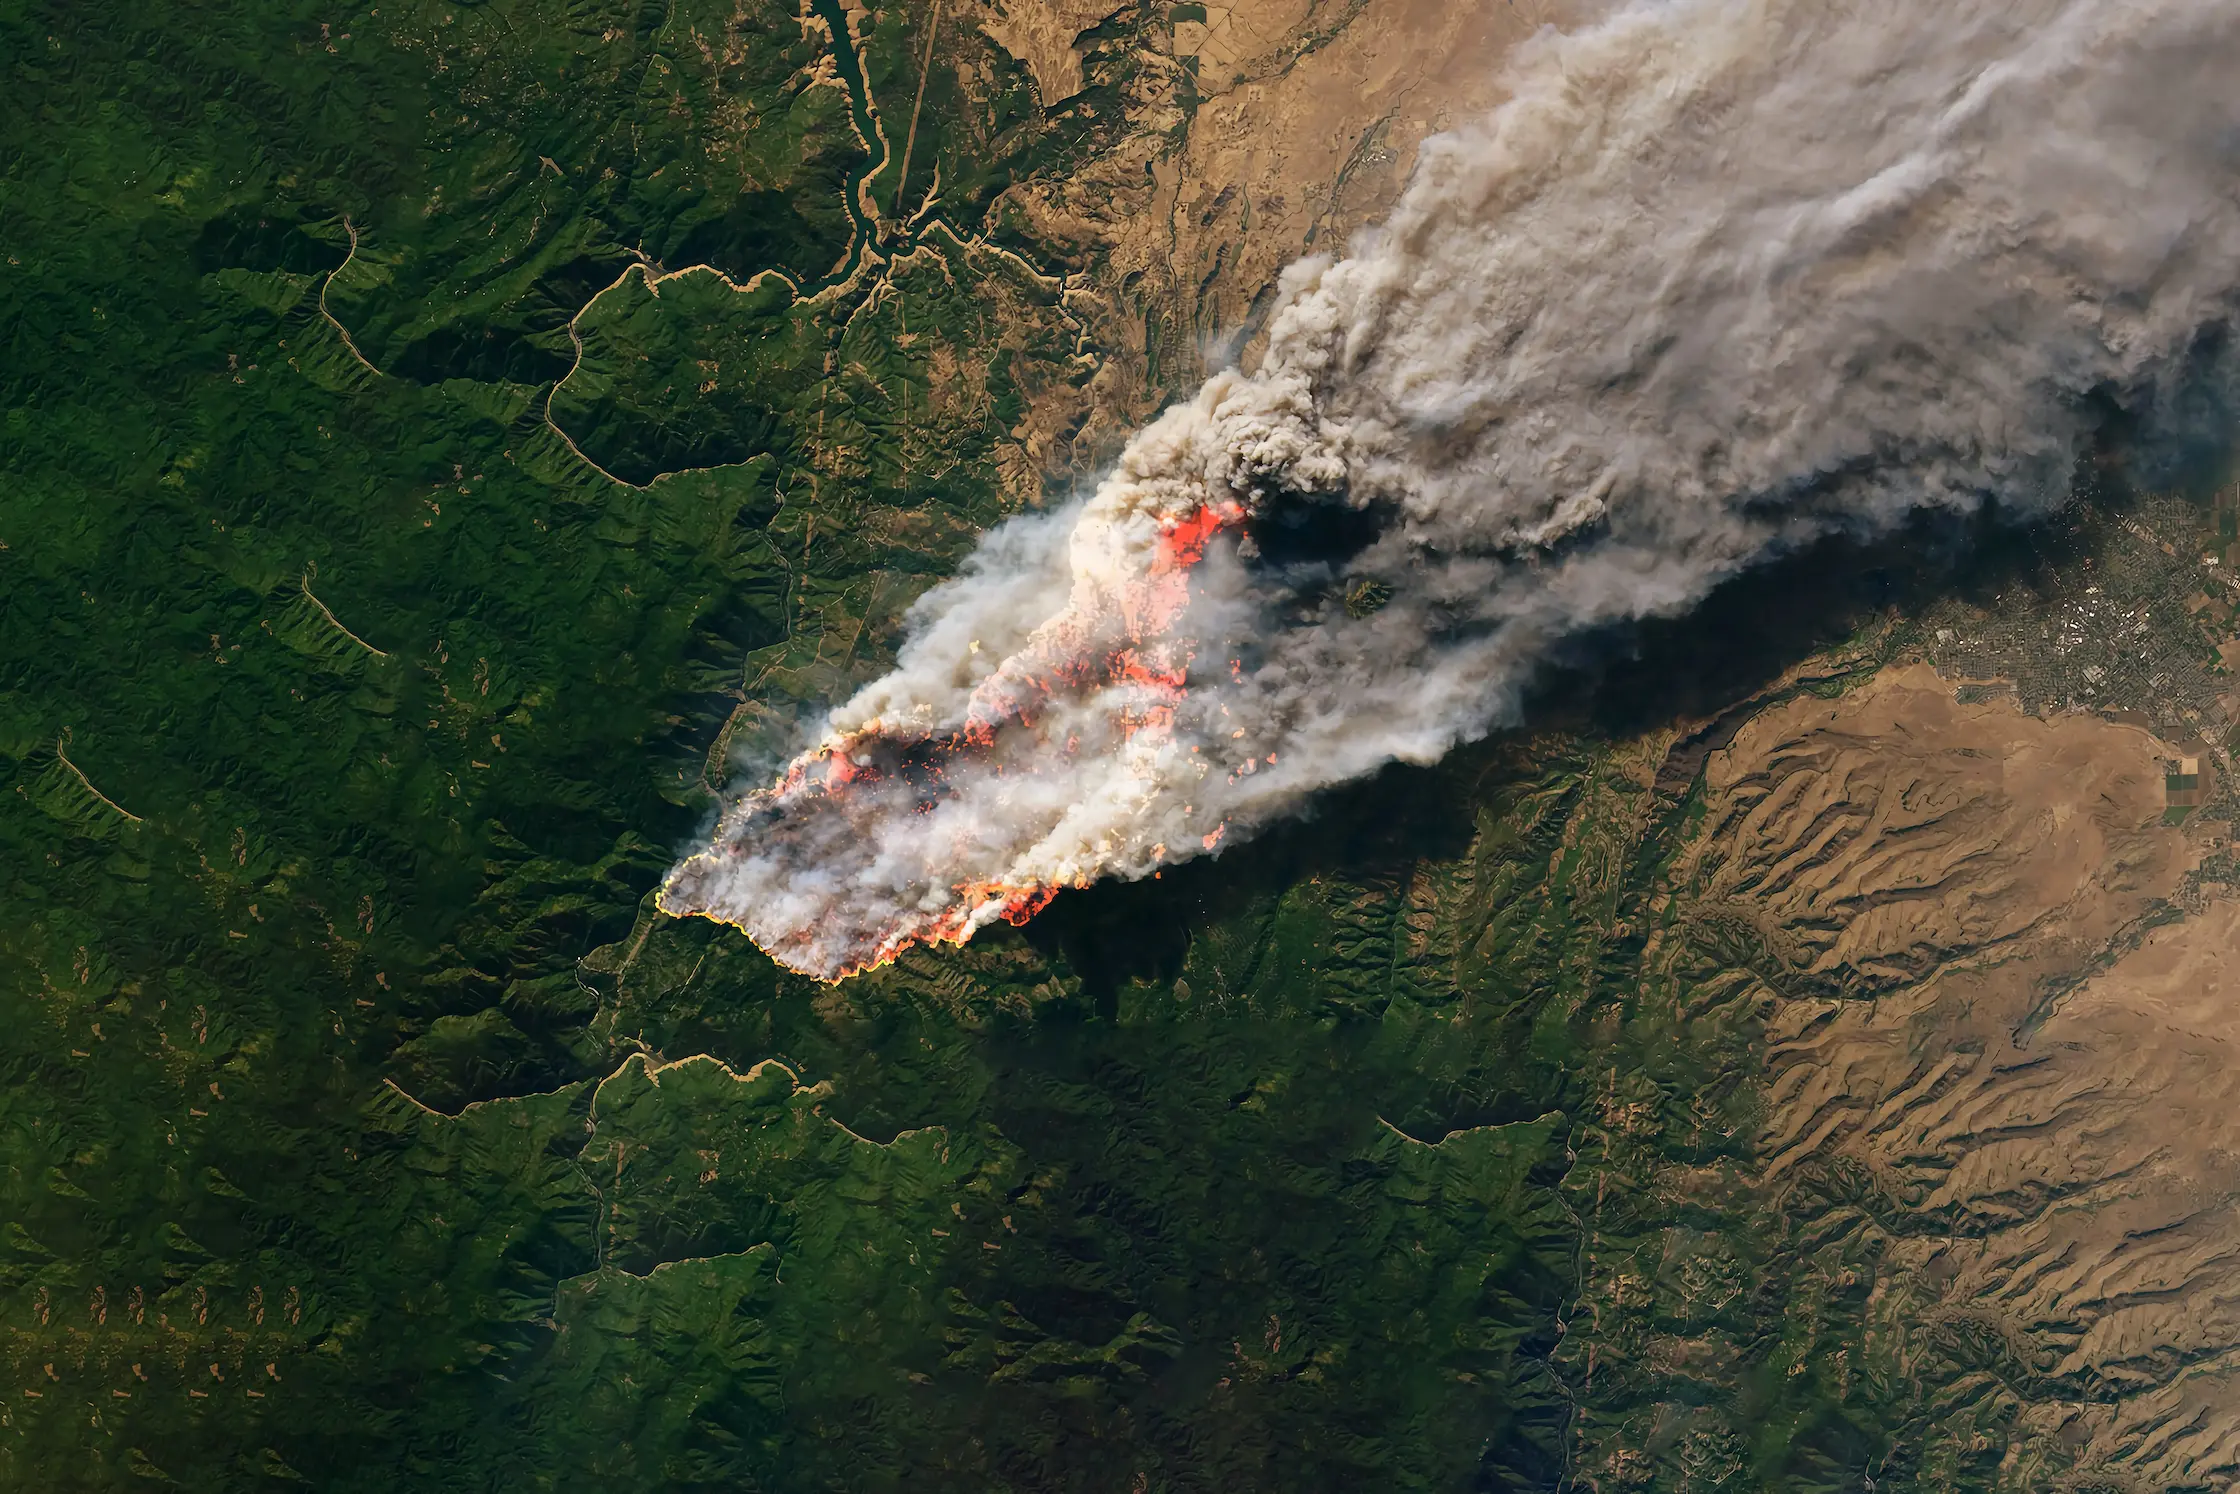
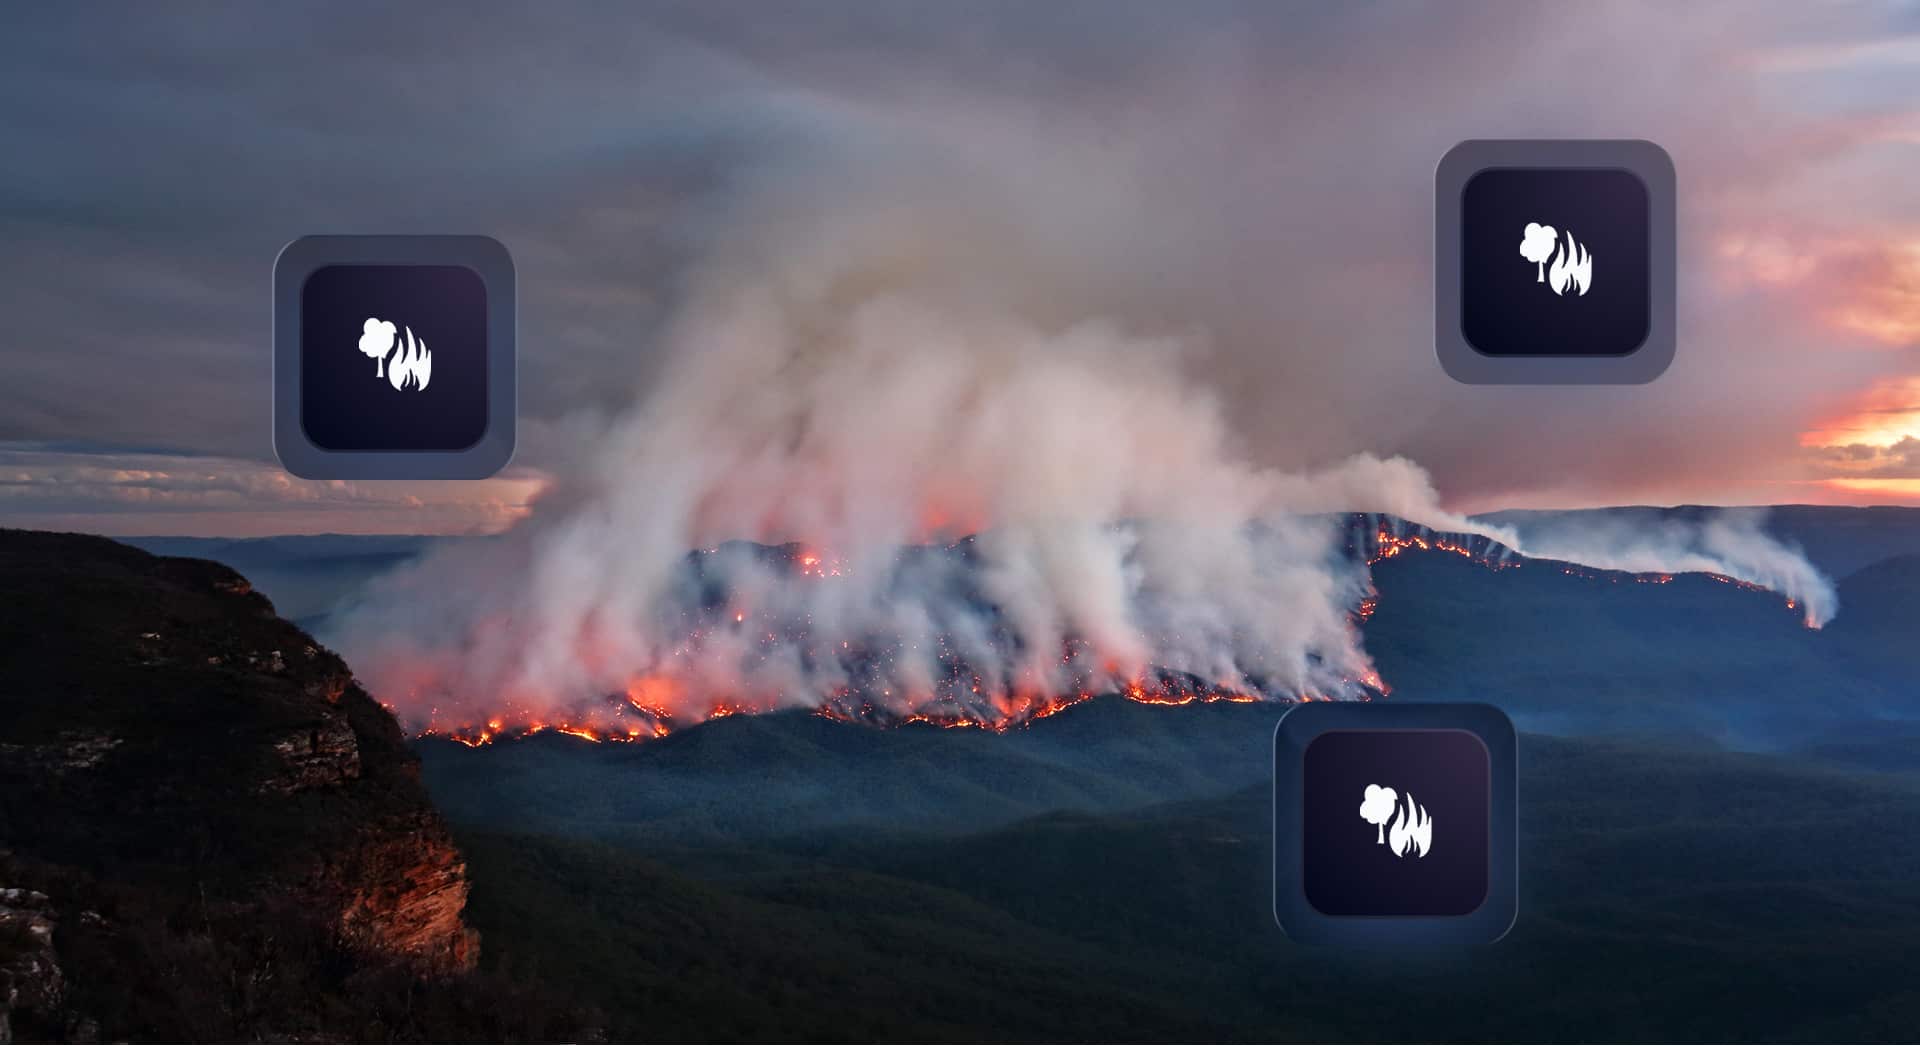
A wildfire is an unplanned and often uncontrolled fire that can spread with very little warning. They are typically driven by a combination of fire-weather (sufficient heat, oxygen and dry conditions), the availability of fuels, and an ignition source which instigates the event (human or natural, e.g. lightning).
Wildfires emerge in areas where these conditions are all present at once. Once a fire has taken hold, flames can spread through landscapes, growing and developing in complex ways according to the local area features such as wind direction, topography and fuel continuity the fire encounters.
These fires can burn for days to weeks at a time, from surface fires which spread laterally through the burning of low lying vegetation (e.g., shrubland) to more intense crown fires which burn through tree canopies and typically contribute to larger economic losses.
Certain local-scale conditions (e.g. the Santa Ana winds) can often make some areas consistently more susceptible to wildfire outbreaks than others. However, due to the many interacting effects which can contribute to the development of wildfires, understanding their emergence accurately at a local scale requires the use of sophisticated modelling techniques.
How we modelled it
BirdsEyeView’s modelling uses a science-based machine learning approach to elucidate these complex, non-linear interactions. Each region of the globe is modelled separately to account for its unique fire regime according to their differing landscapes, ecosystems, topographies and meteorology.
Our machine learning models train on more than 40 meteorological, land use, demographic, vegetation and fuel related variables to predict wildfire occurrence, producing results at the monthly level. Using twenty years of data, calibrated for trends over time, we produce risk estimates (rate of burns) for each month and annual risk (rate and return periods) for full seasonal wildfire analysis.
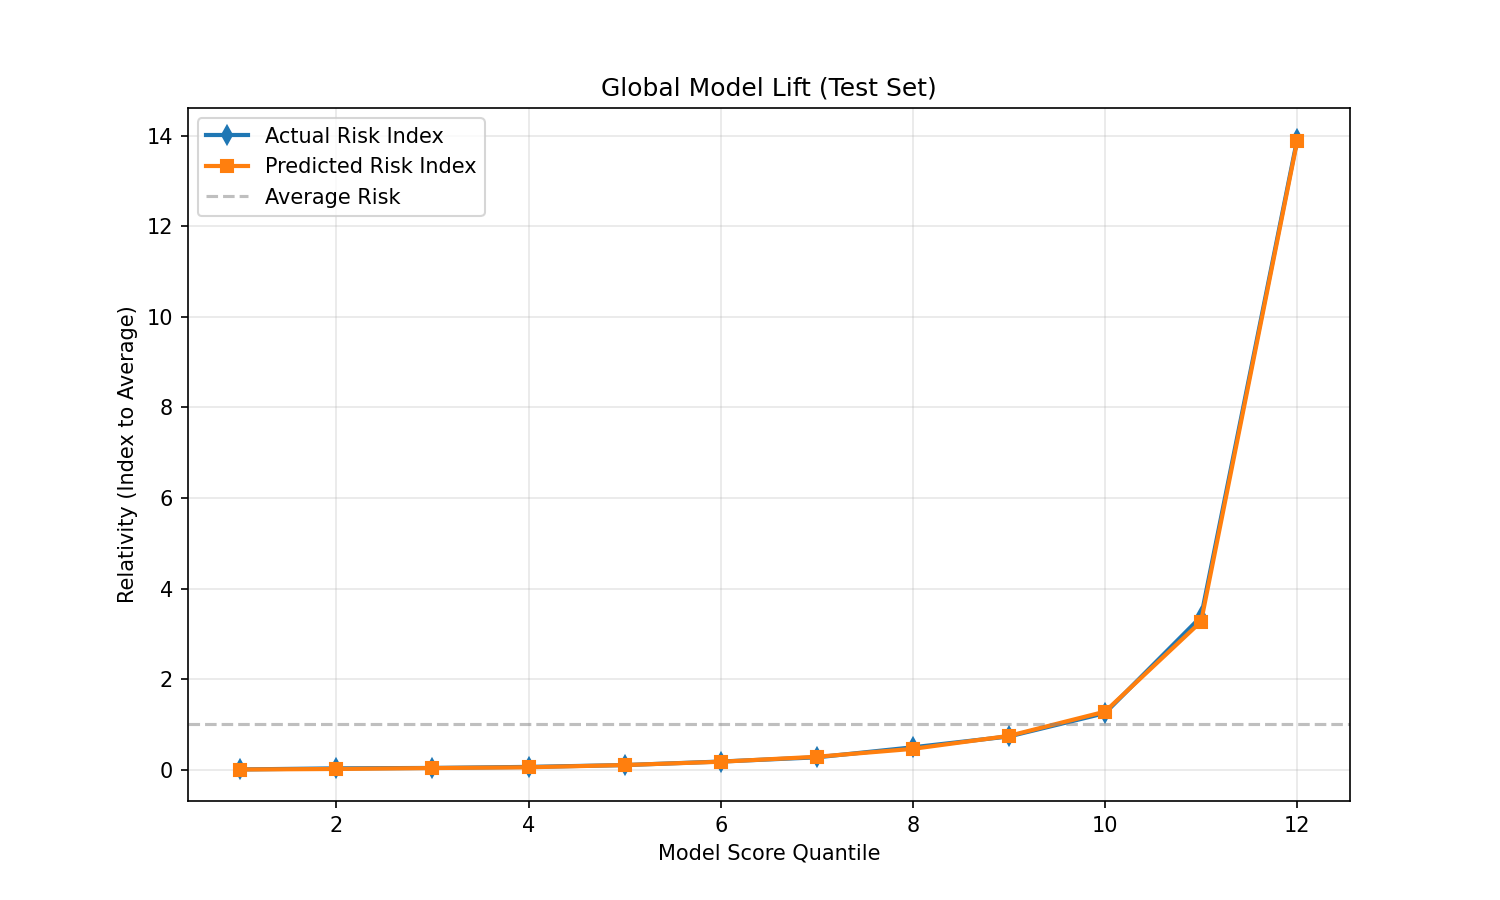
On an independent backtest on four recent years of fires data, our model achieves extraordinarily well calibrated lift curves, accurately distinguishing areas at low and high risk of wildfire occurrence. Our predicted risk across groups of pixel-level fire events follows the empirical rate in those same bins nearly perfectly.
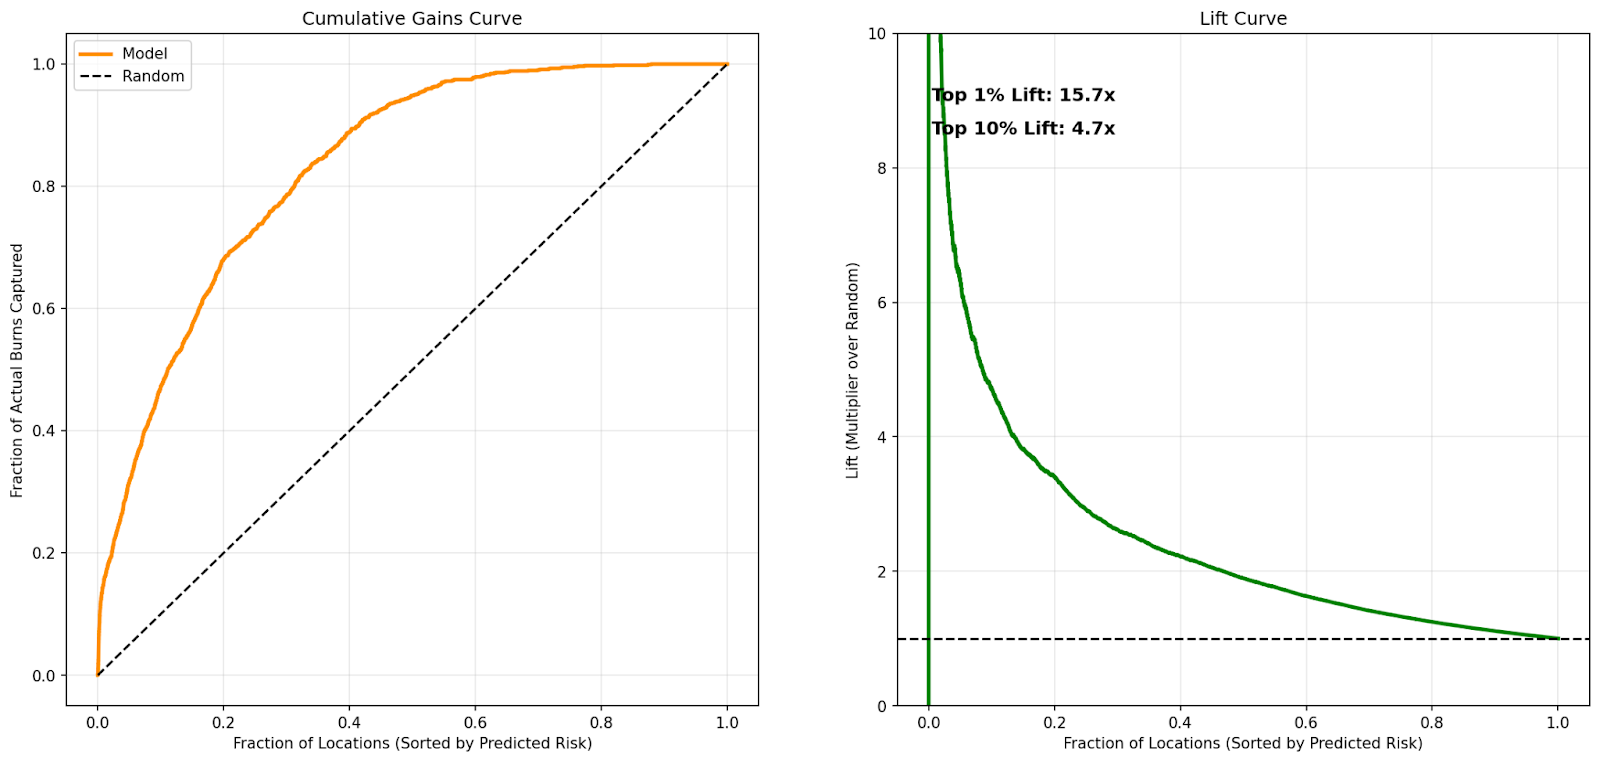
Furthermore, our model achieves high predictive accuracy in distinguishing individual months and locations which experience a fire from those that don’t. In the cumulative gains curve, the height of the orange curve above the dotted diagonal indicates the model’s performance above random chance at succeeding in the “needle-in-the-haystack” problem of identifying wildfire events, which affect just 1 in every 5000 pixels in a given year.
Our careful, multi-stage modelling process enables this balance of event-level accuracy and overall return-period fidelity.
What surprised us
When reviewing standard model approaches within the sector, we found a commonly underrepresented element of the picture was the inclusion of ignition sources. If ignition sources were considered, only low resolution proxy datasets were used to determine a key element of the necessary conditions for wildfires to occur. To address this, our model uses proprietary data at high resolution to reveal the harder to spot relationships which typically lead to fires starting.
We also found that to capture the many aspects of fire fuel dynamics effectively (especially over seasons), it was necessary to use several varied measurement approaches for measuring vegetation. This led to a considerable performance improvement over simpler classifications that only considered fuel availability according to the species type alone.
Just because somewhere experienced a wildfire doesn't mean that specific spot is most at risk. Our model recognises the harder to see underlying relationships to account for all of the places that could have equivalent risks.
Conclusion
The insurance market continues to face growing pressure as wildfire risk intensifies and insured losses rise year after year. In this environment, it’s essential for underwriters to clearly understand their exposure to potential wildfire events and how that risk is changing over time. BirdsEyeView’s wildfire model was built to meet this need, combining expert insight with a data-driven approach that accounts for ignition sources, fire weather conditions, and fuel availability, helping insurers make more informed, resilient decisions at the point of underwriting.
Wildfire risk is evolving faster than traditional models can keep up. How confident are you in the data driving your underwriting and pricing decisions? Are you capturing ignition potential, fuel conditions, and changing climate patterns at the level of detail today’s market demands? BirdsEyeView’s wildfire model is built to help insurers and risk professionals see wildfire exposure with greater clarity and precision. If you’d like to learn more, or explore what this could mean for your portfolio. We’d love to connect.
Teaser for next issue
In our next issue of The BirdsEye Brief, our in-house experts will spotlight BirdsEyeView’s lightning model. As a major driver of wildfire ignition and event cancellation, making it particularly relevant to the contingency market, lightning risk demands accuracy and detail. That’s why our team has focused on building a granular, high-resolution lightning model, designed to better capture its potential impact on the insurance industry worldwide.

BirdsEyeView Secures Seven-Figure Investment to Accelerate Global Expansion
BirdsEyeView, the European Space Agency-backed insurtech specializing in natural catastrophe modelling and exposure management, has secured an undisclosed seven-figure investment to support the company’s continued international growth and ongoing product development.
Have questions about CERA®, integrations, pricing, or use cases for your organization? Our specialists can walk you through the platform and recommend the right solution.
.webp)