




All Resources
Modelling Wildfire Risk at Fine Scale

Modelling Wildfire Risk at Fine Scale

An updated wildfire model for North America and Australia — retrained on two decades of satellite burned-area data and resolved to the scale underwriters price on.

25 Years Burned Area Training Data
80 Input Variables
300m Resolution

Wildfire · North America × Australia

BirdsEyeView × ESA

Modelling wildfire risk at fine scale

An updated wildfire model for North America and Australia — retrained on two decades of satellite burned-area data and resolved to the scale underwriters price on.

Model update · July 2026

01 / Why wildfire is hard to model

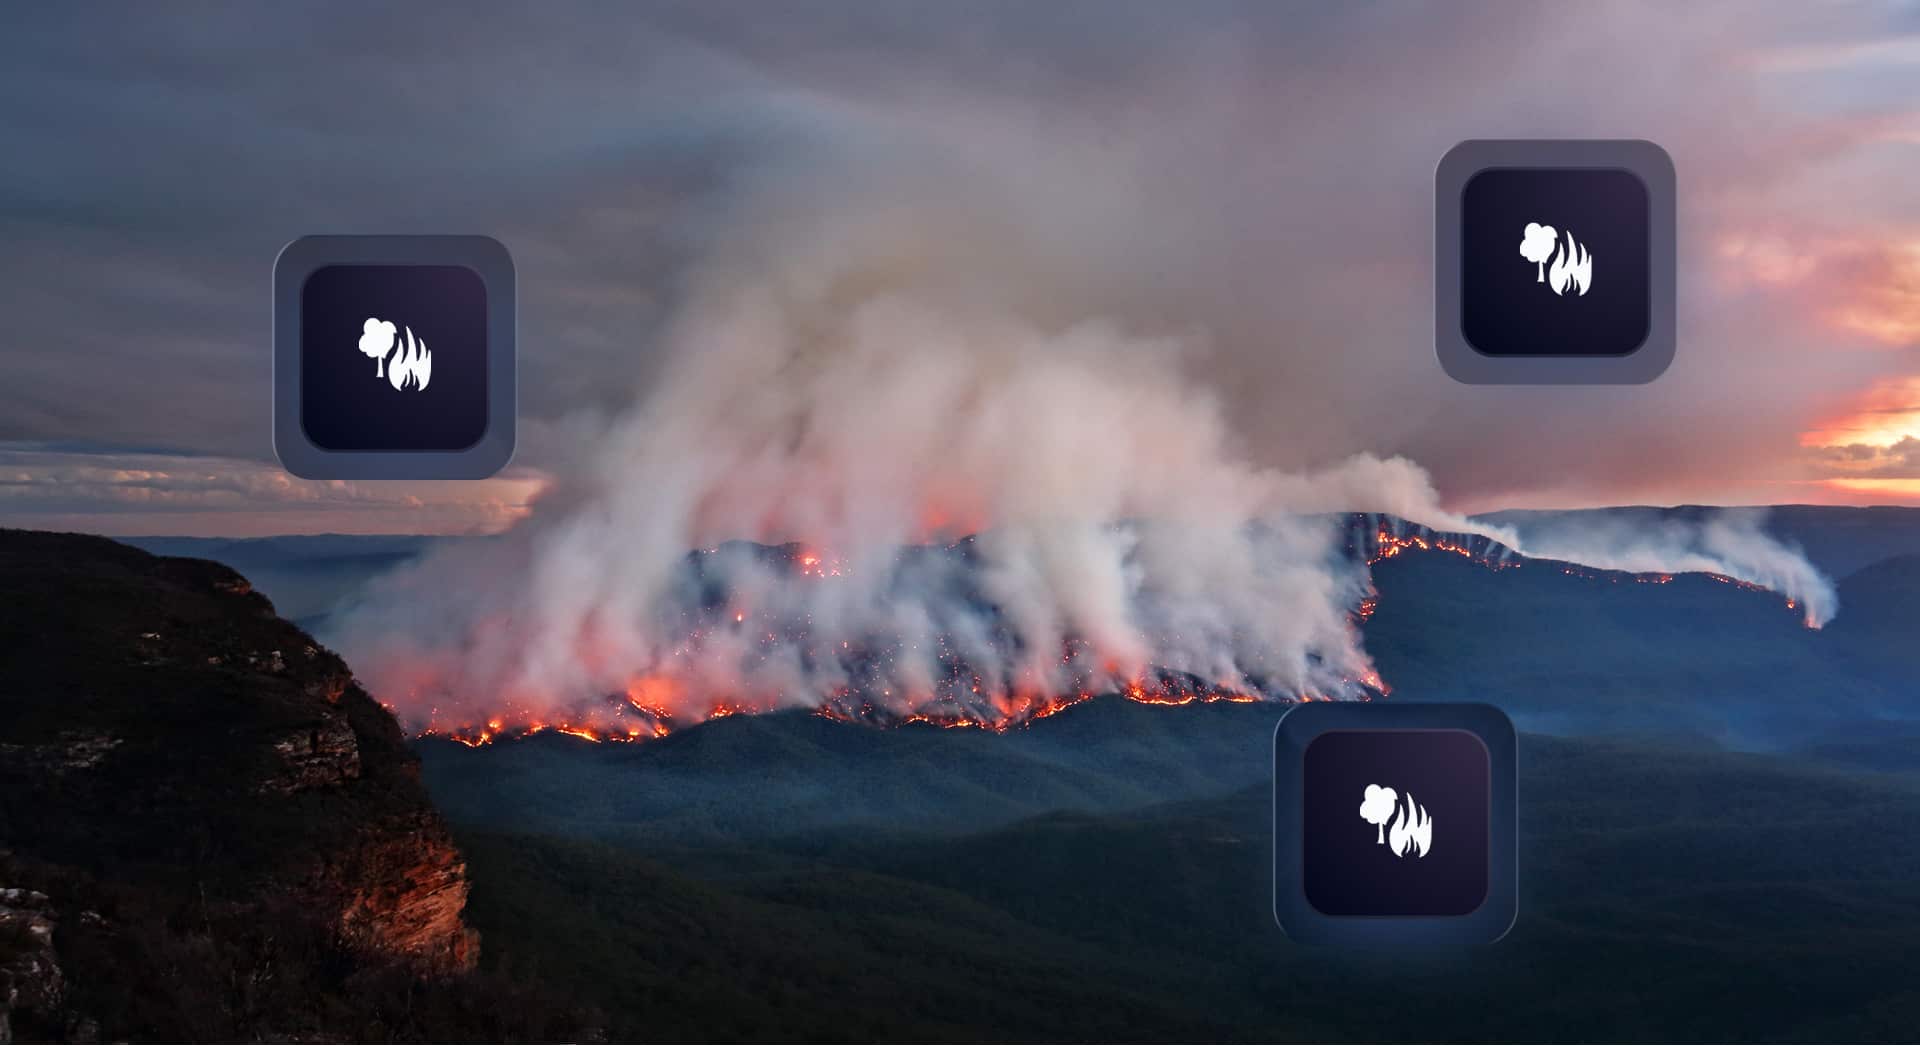
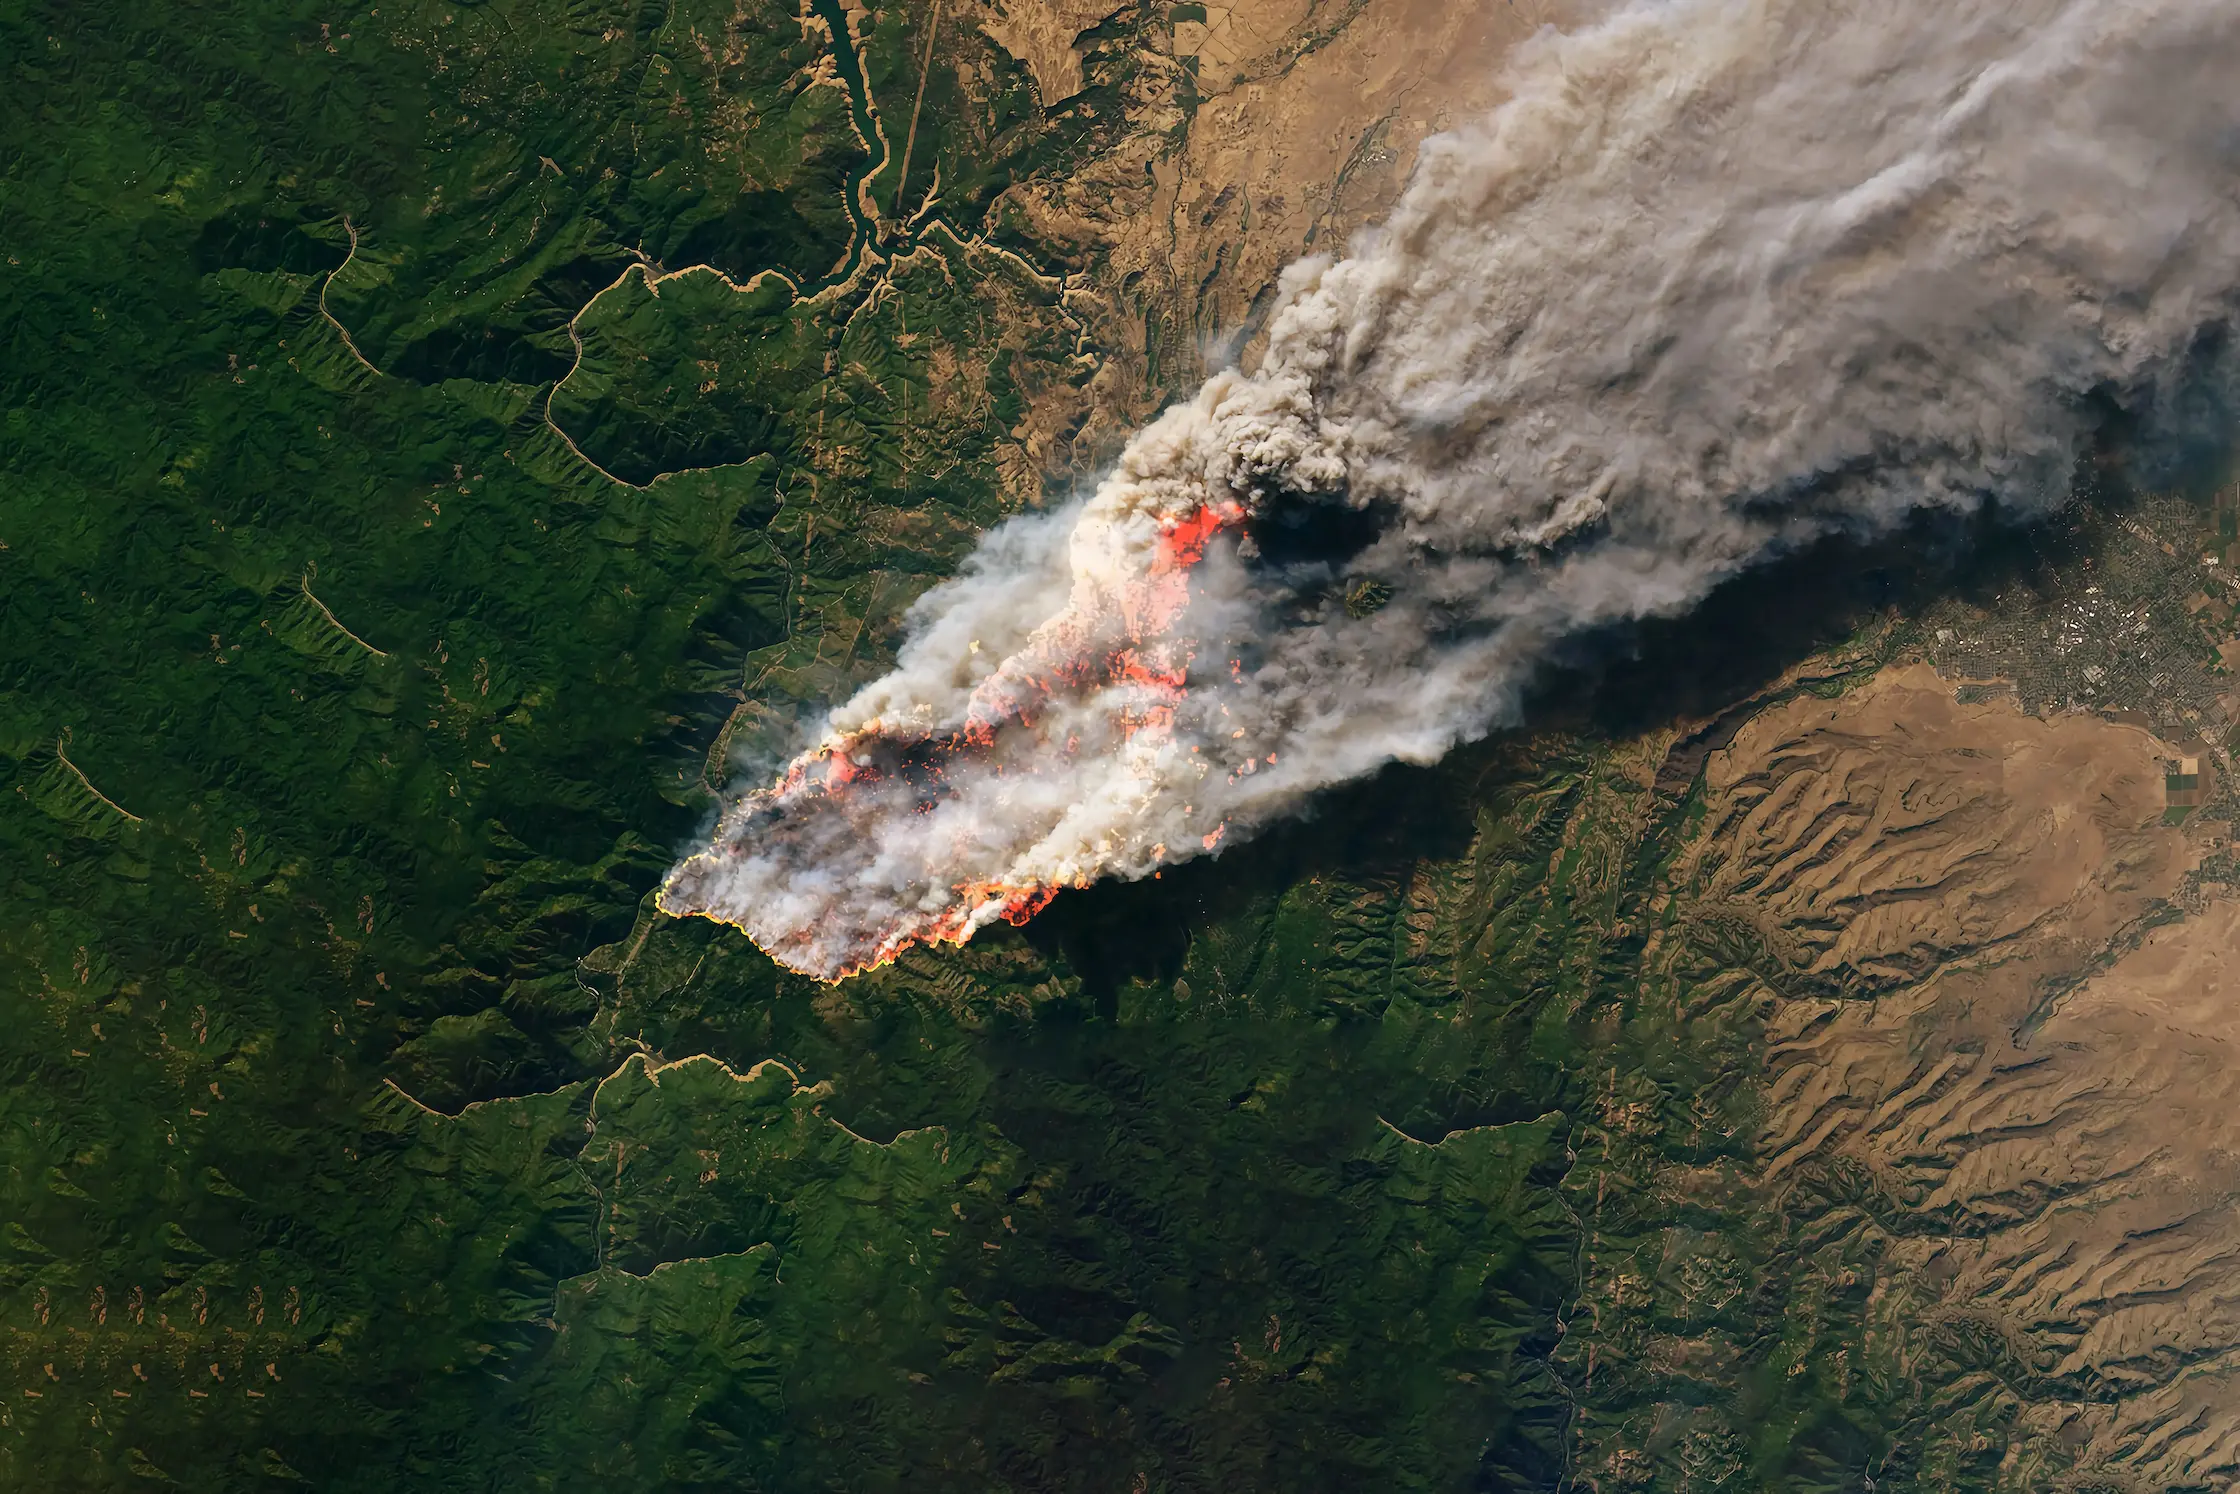
Fire is intensely local. Ignition, weather and fuel interact over metres, not regions. Two parcels a short distance apart can carry very different risk on the same day — one continuous, the other green and broken up. Our updated model is focused at a fine scale, for a specific location.

Burned-area training data

20012025

25 years of fires. Recent years (pink) add a proprietary fuel & moisture layer. Illustrative.

02 / The BirdsEyeView wildfire model

Coverage

North America & Australia

Data for training

Built on 80 input variables, spanning 2001–2025

Fire validation data

ESA Fire CCI + Global Fire Atlas. Two satellite fire data sets.

Additional fuel inputs

Total amount of energy produced by plants, data on plant conditions and structure derived from satellites

Proprietary layer

Fuel & fuel-moisture model, built on ESA data

Resolution

300m resolution

Additional fuel signals

Total amount of energy produced by plants, data on plant health and structure derived from satellites

Proprietary model

Fuel & fuel-moisture, on ESA data

Updated output

Fine-scale wildfire risk

03 / What's changed

Multiple fire targets to learn from

Trained on a harmonised collection of two satellite fire data sets: the ESA Fire Climate Change Initiative and updated Global Fire Atlas data.

Greater coverage

Training data now incorporates fires from 2001 to 2025 — 25 years of observed burned area.

Improved performance

An optimal sampling strategy lifted both precision — how reliably pixels flagged as fire are fire — and recall — how efficiently real fires are detected.

Enhanced explainability

Two complementary approaches explain both model behaviour (what the model relies on) and outcomes (how risk moves with a single variable).

Greater number of input features

Additional measures of fuel — total amount of energy produced by plants and data on plant conditions — feed a proprietary fuel and fuel-moisture model for recent years, built on ESA data. Change in risk now manifests more clearly at fine scales.

04 / Seeing it in CERA®

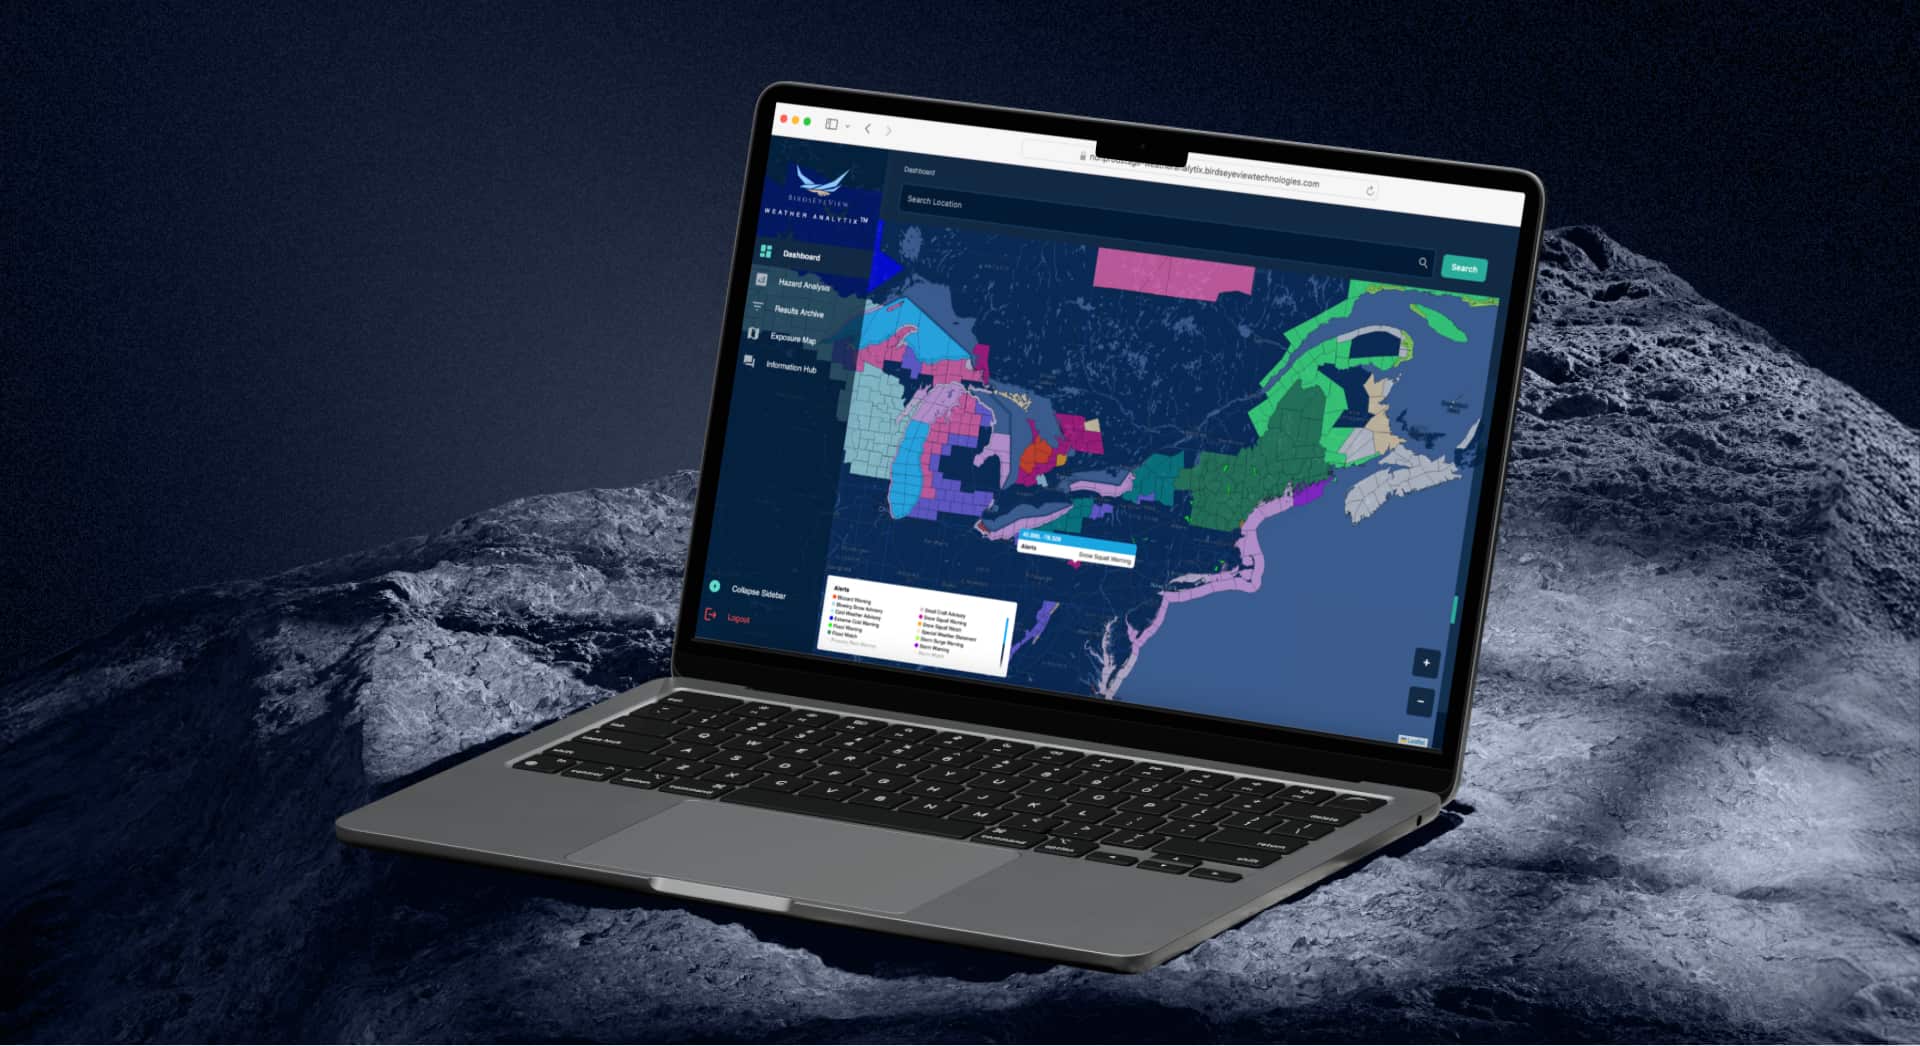
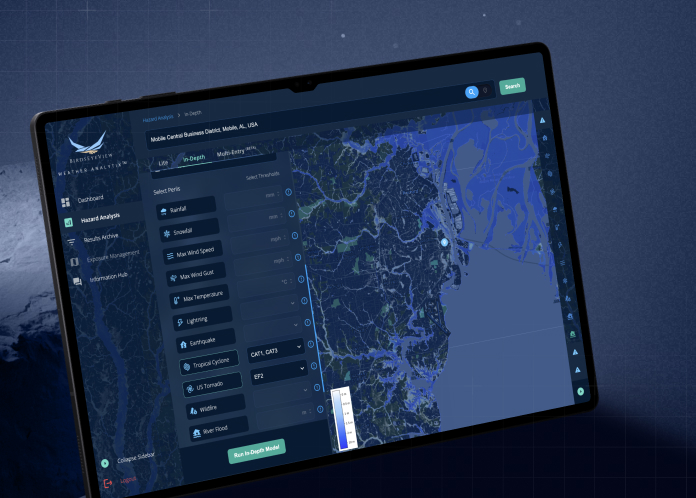
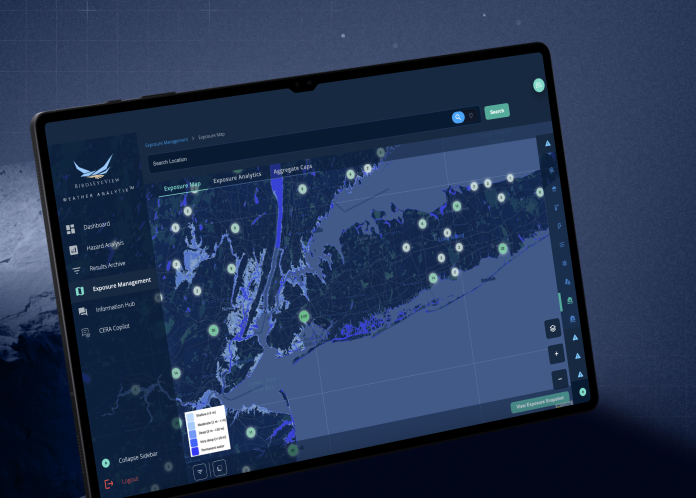
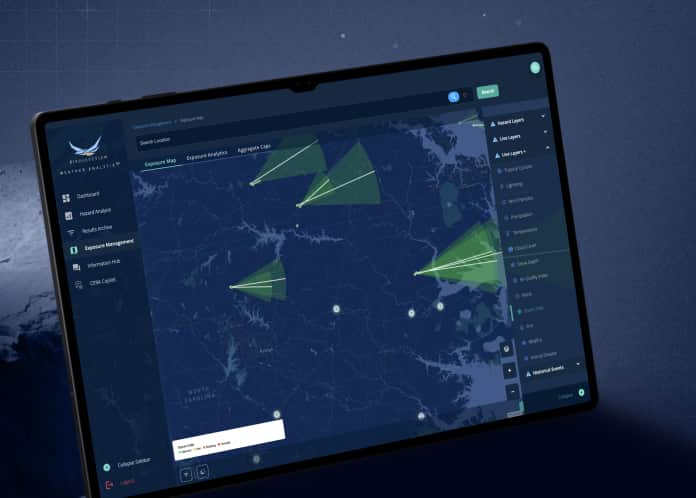
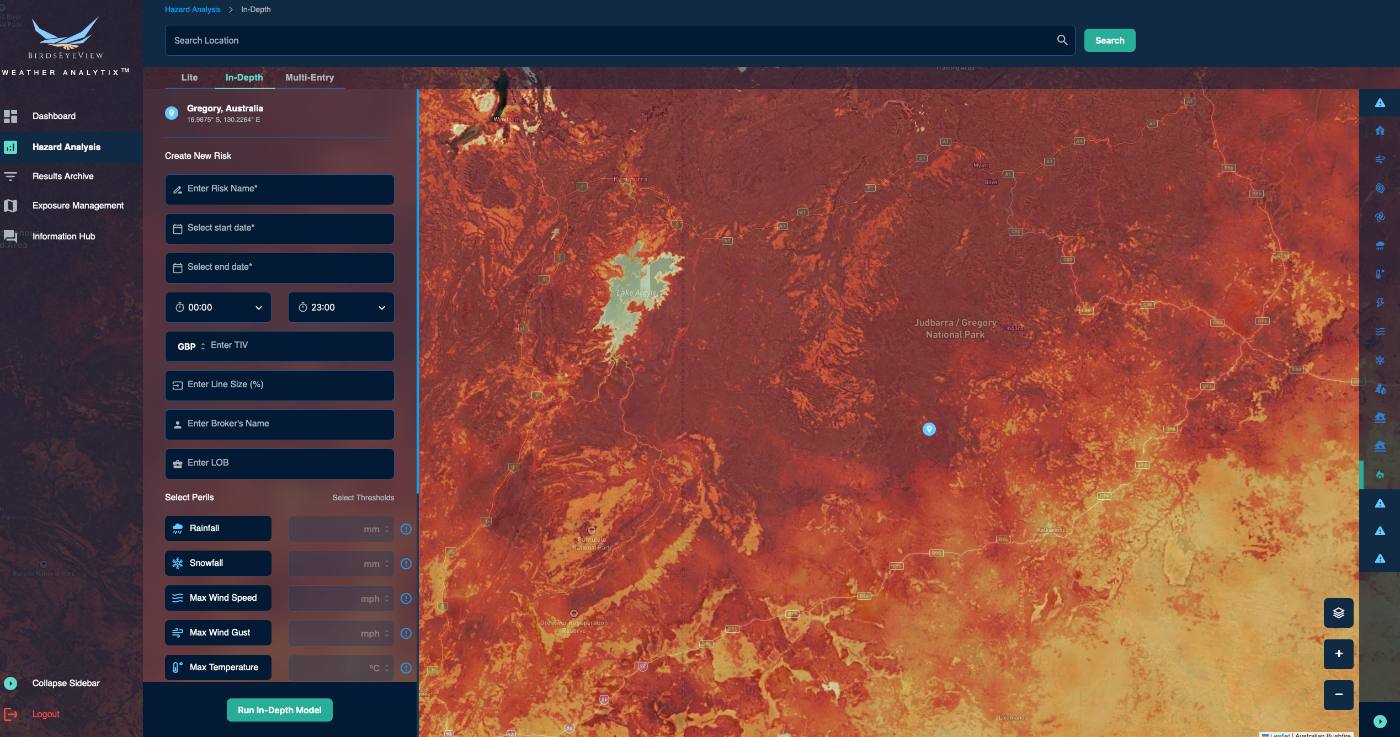
Wildfire risk is surfaced directly in the CERA® hazard map, resolved fine enough to distinguish exposure within a single region. In-depth wildfire analysis over the Gregory region, Australia — change in risk resolved at fine scale.

Run it against your own book.

The updated model is live. If you write property or wildfire-exposed risk, we will run it against locations in your portfolio and show you the numbers.

European Space Agency backed

Sources — Burned-area targets: ESA Fire Disturbance Climate Change Initiative; Global Fire Atlas. Fuel signals: NDVI, gross primary production, and BirdsEyeView's proprietary fuel & fuel-moisture model built on ESA data. Training window 2001–2025. Coverage timeline is illustrative, no absolute scale. BirdsEyeView Technologies Ltd. — Confidential.

Share: