





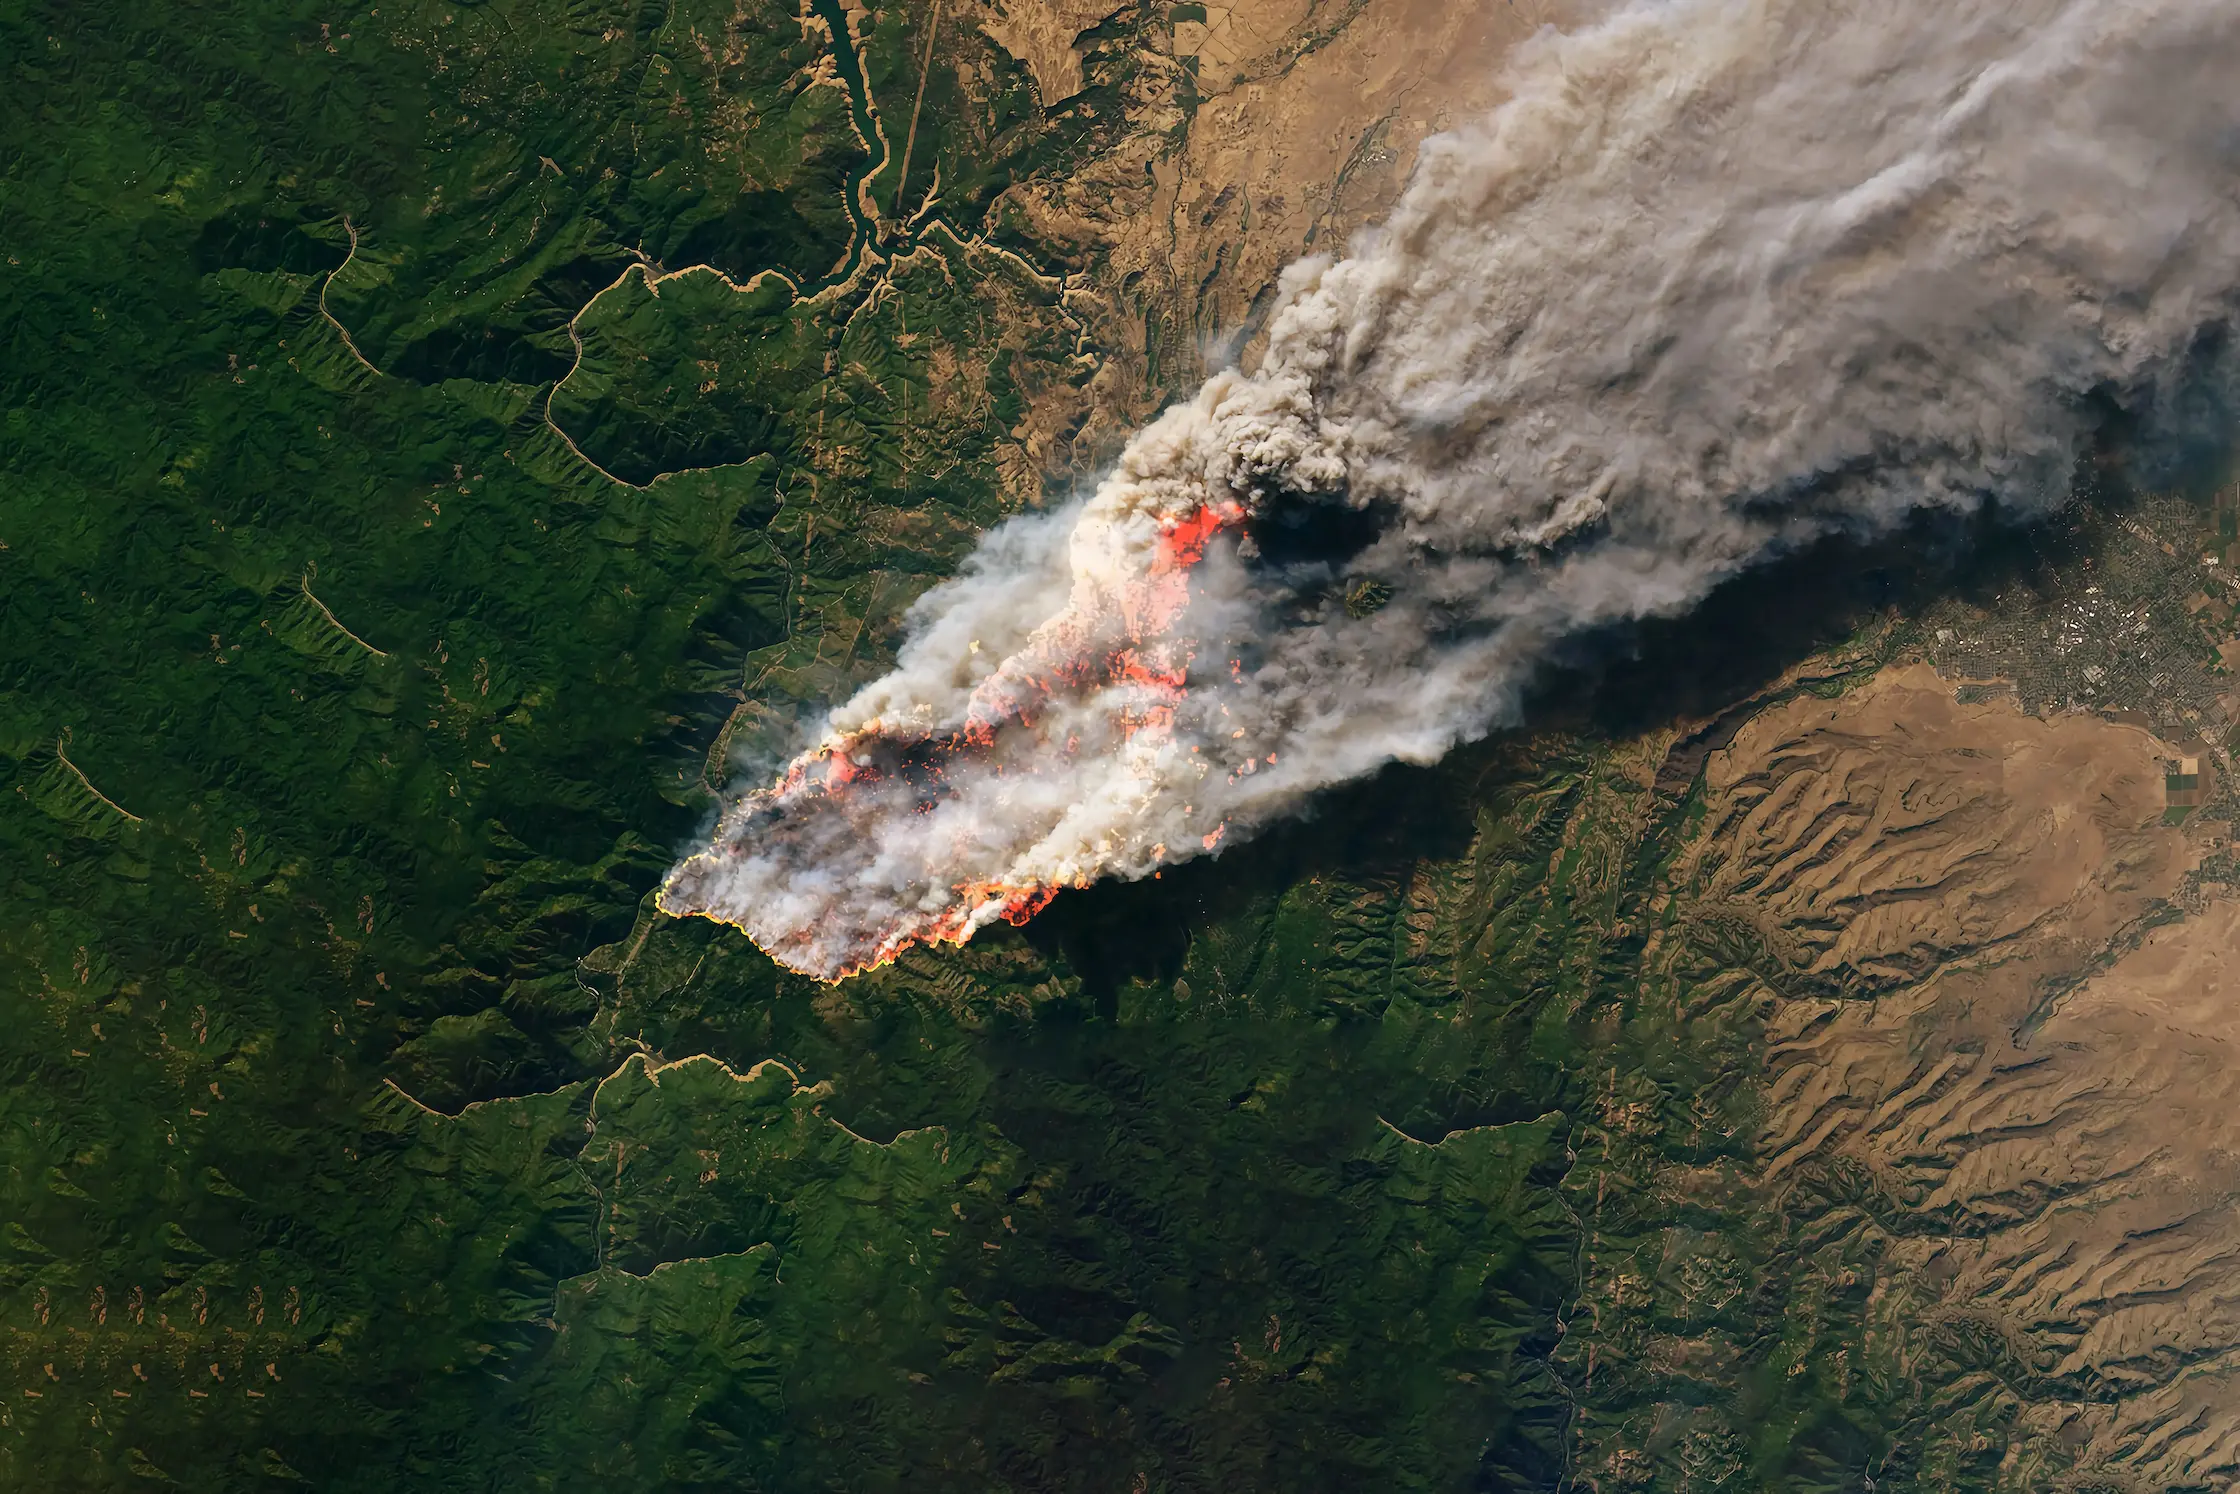
The Data Behind the Fire: A Look Into Our Wildfire Model
Wildfires now result in nearly 6 million more hectares of tree cover loss per year than in 2001, an area the size of Croatia.
Feb 19, 2026
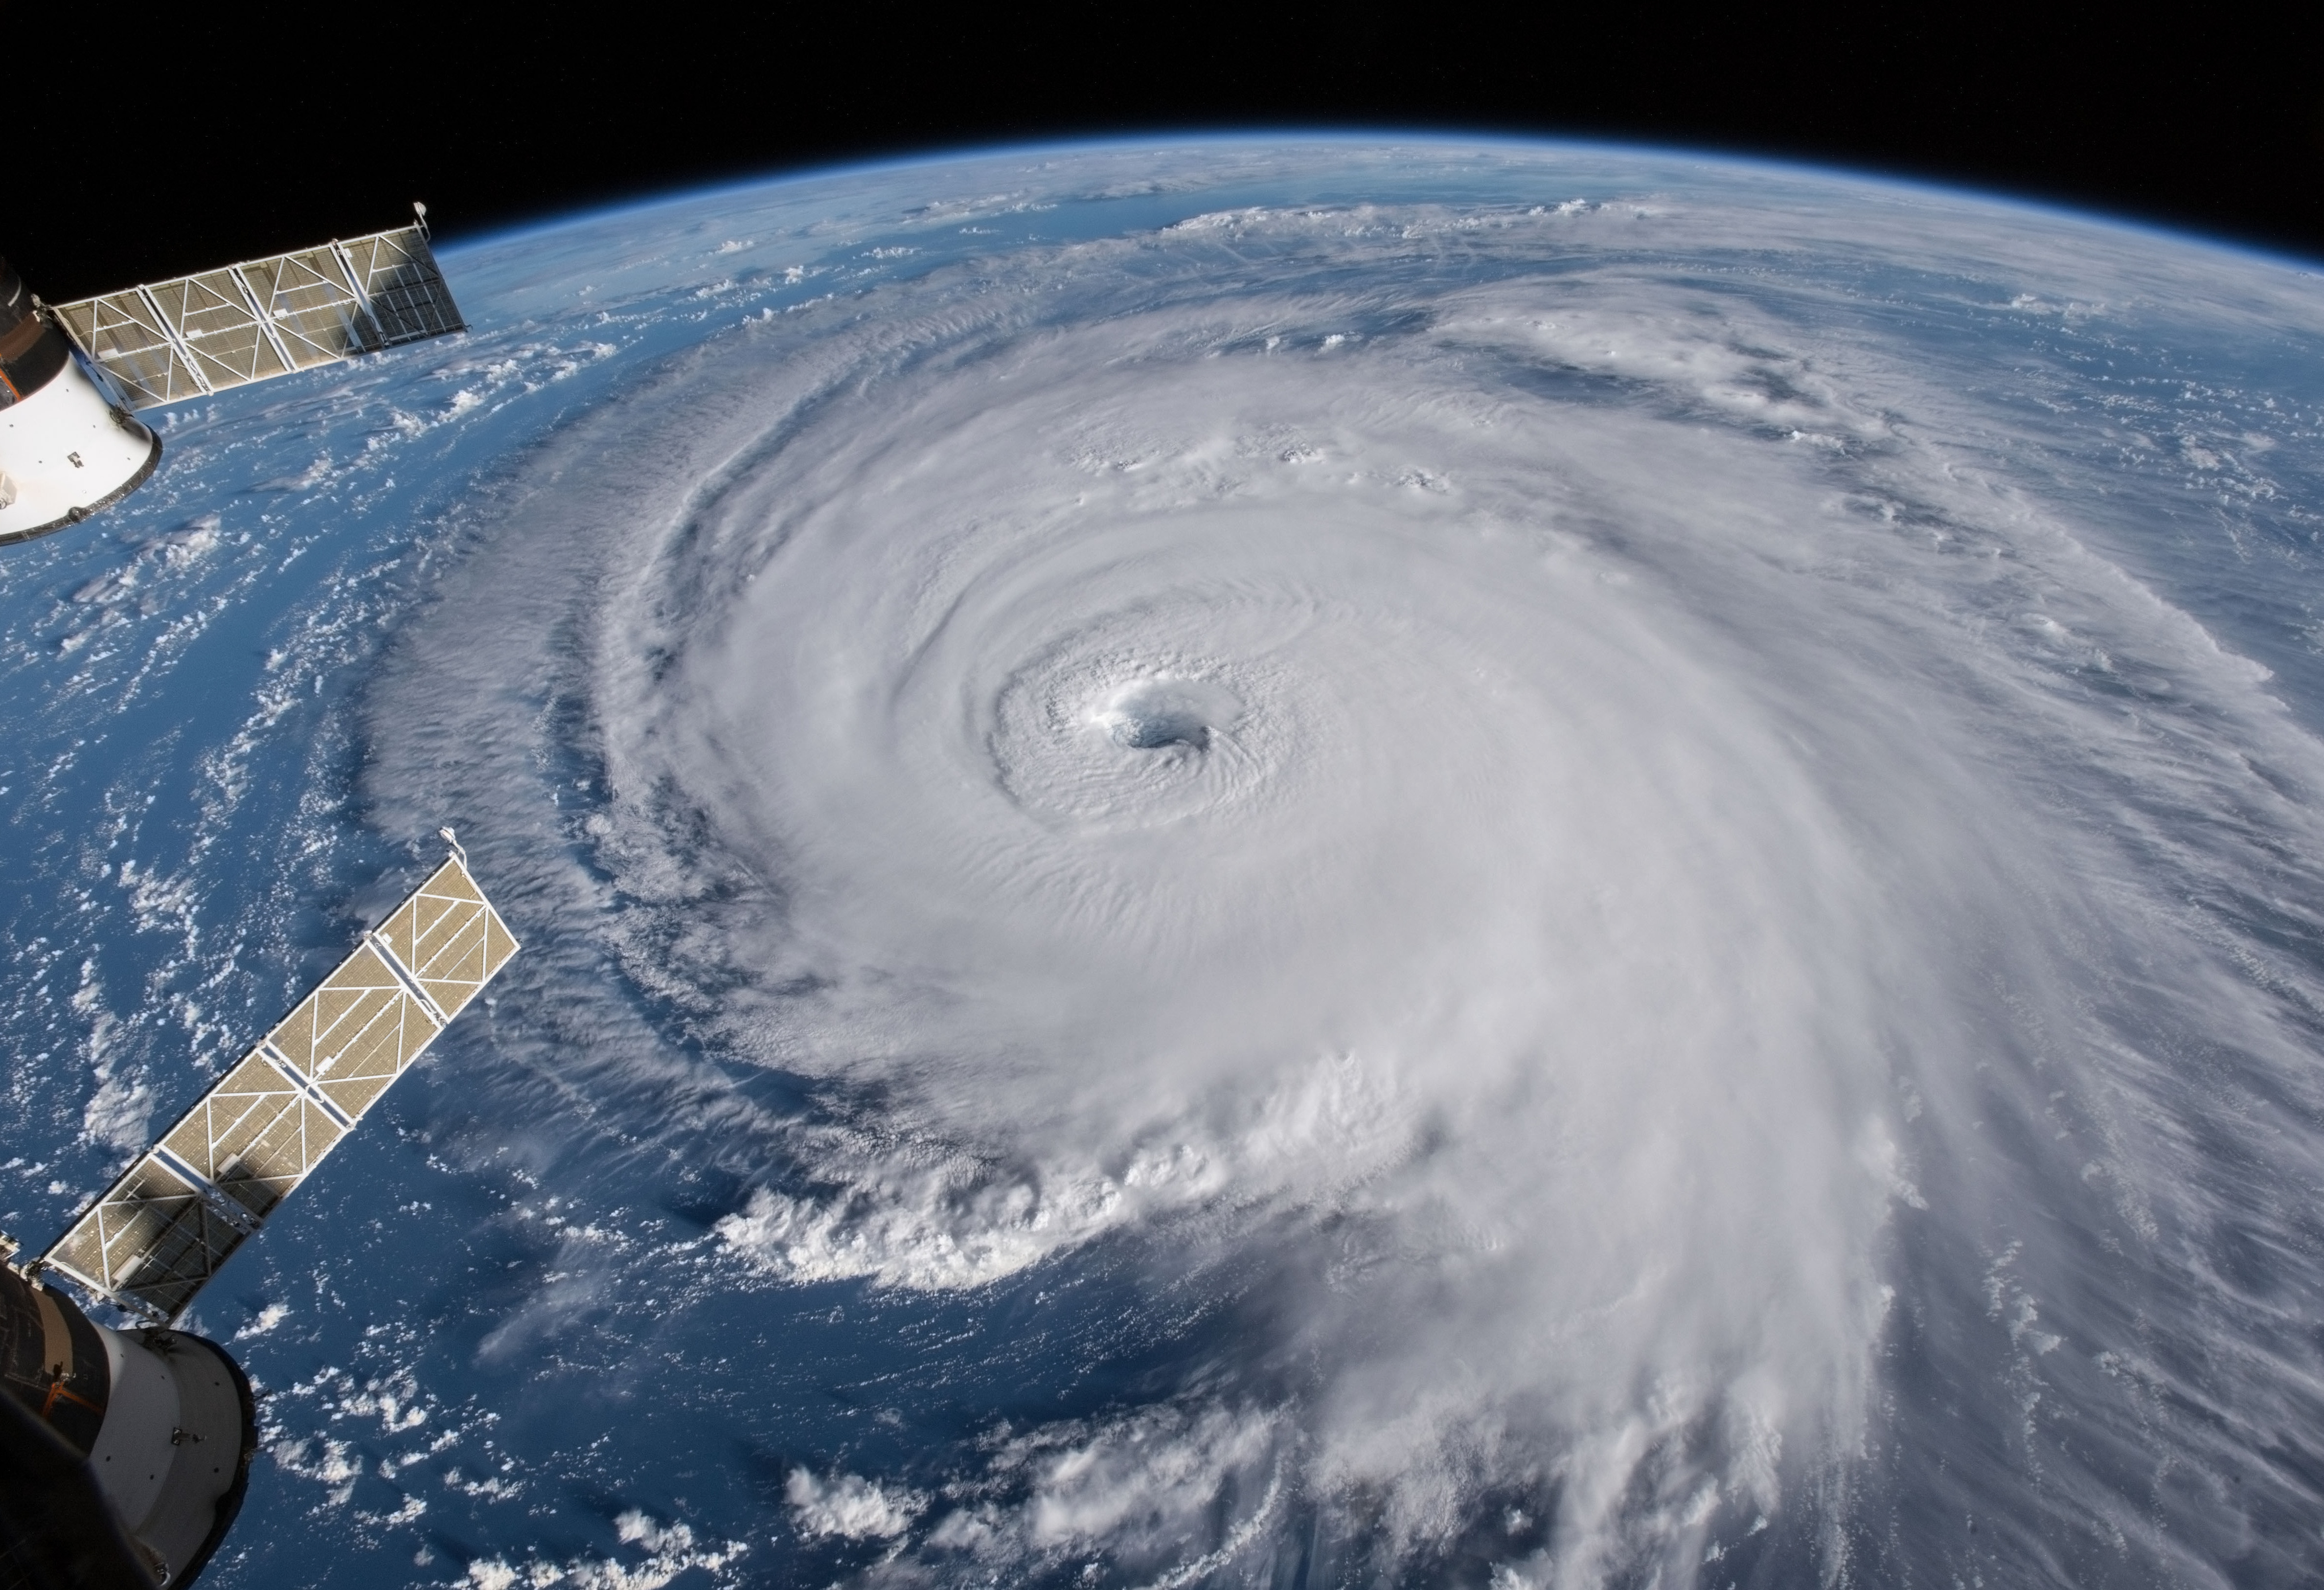
Hurricane Season Report
The Atlantic has produced five named storms and not one hurricane by the start of September, the slowest opening to a season in almost four decades. The reinsurance market has spent the year pricing as though the pattern will hold.
Five storms, no hurricanes, and a market that has already moved
The Atlantic has produced five named storms and not one hurricane by the start of September, the slowest opening to a season in almost four decades. The reinsurance market has spent the year pricing as though the pattern will hold.
| Storm | Date | Landfall |
|---|---|---|
| Arthur | 17 June | Texas |
| Bertha | 19 July | Two Gulf landfalls |
| Cristobal | 12 August | At sea |
| Dolly | 27 August | At sea |
| Edouard | 1 September | Louisiana |
Climatological peak: 10 September. Average date of the first hurricane: 27 July. Latest first hurricane on record: 11 September (2002, 2013). Source: National Hurricane Center; NOAA tropical cyclone climatology.
Arthur, Bertha, Cristobal, Dolly and Edouard have all been tropical storms. None reached 74mph, the threshold for hurricane status.
The average date of the first Atlantic hurricane across the 60 seasons from 1966 to 2025 was July 27. The latest on record in the satellite era is September 11, a mark set in 2002 and matched in 2013. With nothing organised in the basin and the National Hurricane Center expecting no formation over the following week, 2026 is on course to break it.
Accumulated cyclone energy, the measure that combines the frequency, intensity and duration of storms, was running 84 per cent below the 1991 to 2020 average on August 20. Only four seasons in the satellite era have started more slowly: 1988, 1984, 1977 and 1967.
The cause sits in the Pacific. El Niño, the periodic warming of sea surface temperatures in the central and eastern equatorial Pacific, emerged in June and has strengthened since. It lifts vertical wind shear across the tropical Atlantic and the Caribbean, tearing storms apart before they can organise. Saharan dust and cooler than normal water across parts of the basin have added to the suppression.
Forecasters have cut their numbers twice. NOAA's August update called for 7 to 13 named storms, 2 to 6 hurricanes and no more than 2 major hurricanes, against a long-run average of 14, 7 and 3. It put the chance of a below-normal season at 75 per cent. Colorado State University was tighter still, at 9 named storms, 4 hurricanes and 1 major hurricane, with accumulated cyclone energy at 40 to 45 per cent of its long-term average.
None of that removes the exposure. The statistical peak of the season falls on September 10. More than 85 per cent of Atlantic tropical cyclones form between August and October, and about 85 per cent of major-hurricane activity lands in the six weeks from August 20 to October 10. Almost all of the season's capacity to do damage is still ahead of it.
What has arrived has been water rather than wind. Arthur formed off the mid-Texas coast on June 17 and came ashore southwest of Galveston, driving flash and urban flooding across Texas and the northern Gulf. Aon estimated the insured cost in the hundreds of millions of dollars. Bertha made two Gulf landfalls in July. Edouard came ashore near Johnson Bayou, Louisiana, on September 1 with sustained winds of 60mph and left 18 to 20 inches of rain across parts of Hardin County, Texas, in two days. Rescue operations were still running this week.
Every American East Coast hurricane this season has been a rainfall event.
Three of the most expensive storms in American history arrived in seasons that were, by the count, unremarkable.
1992 produced 7 named storms, 4 hurricanes and a single major hurricane, and ranks among the least active seasons on record. The major hurricane was Andrew, which crossed south Florida as a category five and caused about $26.5 billion of damage in the dollars of the day, making it the costliest tropical cyclone on record at the time.
1983 was quieter still. 5 named storms, the least active season of the satellite era and the least active of any since 1930. 1 of the 4 was Alicia, which came ashore over Galveston Island on August 18 with sustained winds of 115mph, blew out windows in downtown Houston and caused about $3 billion of damage.
1965 ran under a strong El Niño, the same pattern suppressing the basin this year. 6 named storms, 4 hurricanes, 1 American landfall. That landfall was Betsy, which struck Key Largo as a category three and Grand Isle, Louisiana, as a category four, and which carries normalised losses of more than $13 billion.
The counter-example is 2013, and it is the one the market tends to forget. 14 named storms, only 2 hurricanes and no major hurricane at all, the first season since 1994 without one. The first hurricane, Humberto, did not appear until September 11. Nothing of consequence made landfall. Reinsurance pricing then softened for four consecutive years.
Two lessons sit in that record. Storm counts are a poor guide to loss. And a run of quiet years is where pricing discipline tends to be given away, rather than where it is tested.
| Season | Named storms | Notable |
|---|---|---|
| 1965 | 6 | Betsy — Cat 4 Louisiana landfall |
| 1983 | 4 | Alicia — Cat 3 over Galveston |
| 1992 | 7 | Andrew — Cat 5 over south Florida |
| 2013 | 14 | No major hurricane for the first time since 1994 |
| 2026 to date | 5 | No hurricane of any strength |
1991–2020 average: 14 named storms. Source: National Hurricane Center; NOAA historical hurricane records.
Whilst the Atlantic and the gulf has been quiet on the hurricane front, the Pacific is experiencing greater cyclonic activity. El Niño is the cause of both. The activity in the Pacific is due to the changing atmospheric conditions that come from the massive "global heat engine" that is a positive ENSO — it has weakened the equatorial trade winds ("easterlies"), resulting in a build up of ocean temperatures and moisture in the Pacific.
| Checkpoint | Index (2024 peak = 100) |
|---|---|
| 2017 soft-market low | 58 |
| 2024 hard-market peak | 100 |
| 1 January 2026 renewals | 81 |
| Mid-2026 renewals | 77 |
Down 23 per cent from the 2024 peak, and still 32 per cent above the 2017 floor. Guy Carpenter global property catastrophe rate-on-line index. Source: Guy Carpenter, July 2026 renewals report.
Reinsurers have not waited for the season to finish. Guy Carpenter's global property catastrophe rate-on-line index fell 12 per cent at the January renewals and has fallen further since, leaving it down about 16 per cent across 2026. That is the steepest annual decline since the late 1990s and steeper than any single year of the soft market of the 2010s. The index now sits 23 per cent below its 2024 peak, though it remains about 32 per cent above the floor it reached in 2017.
Capital explains most of it. Global reinsurance capital reached a record $790 billion at the end of March, on Aon's measure, with alternative capital at $141 billion. The catastrophe bond market stood at $65.6 billion outstanding at the end of June, up from $61.3 billion at the close of 2025, after a first half of issuance of almost $18 billion. May was the most active month the market has recorded, with 20 transactions and close to $7 billion of new risk capital.
Losses have supported the trend, although the market cannot agree on their size. Swiss Re put global insured catastrophe losses at $42 billion for the first half of 2026, the lowest first half since 2020 and 16 per cent below the ten-year average. Gallagher Re put the figure at at least $46 billion and Aon at at least $47 billion. That is a spread of about 12 per cent on a six-month period that has already closed.
Severe convective storm, not wind, did the damage. Swiss Re attributed $28 billion of the half to it, roughly two thirds of the total. Aon put American severe convective storm losses at about $27 billion, against more than $40 billion over the same months in each of 2023, 2024 and 2025.
The 2026 season may finish without an Atlantic hurricane. That would be a record, and it would tell underwriters almost nothing about the risk they carry into 2027. Andrew, Alicia and Betsy all arrived in seasons that looked like this one. The question at Monte Carlo is what has been given away in terms and attachment while the basin was quiet.
A late first hurricane says little about October. Two thirds of an average season's activity falls between August 20 and October 10.
Between 1980 and 2025, 190 Atlantic cyclones intensified rapidly and 46 of them, nearly a quarter, gained at least 50 knots in 24 hours. Rapid intensification is on average 50 per cent more likely during a marine heatwave. A storm that reaches major-hurricane strength in a day compresses the window on which claims preparedness depends.
American homeowners' policies have historically excluded flood and treated storm surge separately. Regulatory scrutiny and claims interpretation are moving towards broader recognition of water damage. That shifts exposure without changing the modelled wind footprint.
Moody's surveyed 40 primary insurers before Monte Carlo and found reinsurers expected to hold the line on attachment points and terms while a growing share of buyers expect further price cuts. Terms are the variable to watch into January.
NOAA gives a better than 90 per cent chance of a very strong event through the winter, and a 69 per cent chance that October to December sets a record in a series running back to 1950. There is little sign of a transition before spring 2027. Strong events have historically been followed by a swing towards La Niña, which favours Atlantic activity. A quiet 2026 raises the odds on 2027 rather than lowering them.
Verisk puts the modelled average annual insured natural catastrophe loss at $171 billion. Hurricane is the peak peril for the reinsurance market but it is not the volume peril. A season with no Atlantic hurricane can still be an expensive year.
Sources: NOAA National Hurricane Center and Climate Prediction Center; Colorado State University Tropical Meteorology Project, August 2026; Swiss Re Institute, first-half 2026 insured catastrophe losses; Gallagher Re and Aon first-half 2026 catastrophe reports; Guy Carpenter Global Property Catastrophe Rate-On-Line Index, July 2026; Aon Reinsurance Market Dynamics, midyear 2026; Artemis Deal Directory and Q2 2026 catastrophe bond market report; Moody's Ratings reinsurance buyer survey, September 2026; Verisk global modelled catastrophe losses; Nature Communications, rapid intensification and marine heatwaves. All figures verified on 3 September 2026.
This document is published by BirdsEyeView Technologies Ltd for general information. It is not underwriting, investment or actuarial advice, and it is not an offer of insurance or reinsurance. Figures are drawn from the public sources listed above and are current at the date of publication. BirdsEyeView is reinsurer-independent and holds no position in any programme referenced.
BirdsEyeView Technologies Ltd | The 2026 North Atlantic hurricane season | September 2026
The Data Behind the Fire: A Look Into Our Wildfire Model
Wildfires now result in nearly 6 million more hectares of tree cover loss per year than in 2001, an area the size of Croatia.
.webp)
Introducing AI Data Scrubbing: Streamlining Exposure Data for Faster Hazard Modelling
Exposure data sits at the heart of effective catastrophe and hazard modelling.

BirdsEyeView Secures Seven-Figure Investment to Accelerate Global Expansion
BirdsEyeView, the European Space Agency-backed insurtech specializing in natural catastrophe modelling and exposure management, has secured an undisclosed seven-figure investment to support the company’s continued international growth and ongoing product development.
Have questions about CERA®, integrations, pricing, or use cases for your organization? Our specialists can walk you through the platform and recommend the right solution.
Get a concise overview of our hazard models, exposure analytics, live alerting, and platform capabilities. Perfect for sharing with underwriting, portfolio, and catastrophe teams.